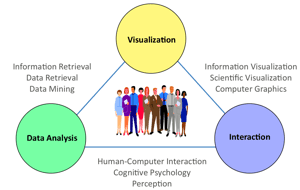
Tableau is one of the most frequently used data analytics tools. It is used for data visualization where the data is represented in a pictorial or graphical form. The raw data is converted into an understandable format by Tableau which can be further used for data analytics.
Firms use Tableau to understand the data and to use data analytics for empowering their business. Tableau helps in decision-making via forecasting, analytics, risk assessment, etc.
Let us see more about Tableau and how it helps in decision making & data visualization.
Importance of Visual Analytics
Visual analytics is the analytical reasoning of data via interactive visual interfaces which in this case is Tableau. Visual analytics helps in understanding the data better, finding outliers in the dataset, discovering insights, etc.
You can identify new opportunities for your business if you are visualizing your data via a good platform like Tableau. The benefits of using Tableau for visual analytics are as follows:
- Tableau has excellent visualization capabilities and it helps in converting unstructured data into absolute logical results that are interactive. It is far better and powerful than its equivalent tools available in the market.

The easy-to-use interface of Tableau provides data analysts to work faster and better. The drag-and-drop way of arranging unstructured data into diagrams and graphs makes it easier for beginners.Tableau is powerful and provides high performance of big data sets too. Beginners can easily complete Tableau training in less time and can get fluent in using it. - You can create a unified dashboard on Tableau where you can connect to multiple data sources. You can connect your dashboard with Hadoop, SAP, DB, etc., and can visualize data better.
- There are a lot of Tableau users throughout the globe and one can find a helpful Tableau community on online forums. Tableau also provides a mobile application through which you can keep your visualized data at your fingertips.
How Tableau Accelerates Decision Making?
Tableau helps in visualizing and analyzing data. The structured data can be used for risk identification & management, increasing ROI, business forecasting, etc. You are well informed about your firm's situation via data analytics and get to know about the upcoming market trends. You access the risk involved in any new opportunity via data analysis and then obtain it if is going to boost your business.

Data analysis introduces clarity in your organization with a data-driven approach to obtain business objectives. Decision-making is hugely impacted via the use of data visualization tools and you will stay ahead of other firms in the market.
One can easily create and share analytics reports to your employees via Tableau, giving a sense of clarity. You can also use customer data to provide better services to them in the future. One can complete Tableau training online to understand how to use it.
Conclusion
Tableau is a powerful data visualization tool that can boost your business with better market predictions & risk assessment. Recent innovations in data analysis due to AI & machine learning have taken data analysis to a next level. You can learn more about data analysis via analytics courses available online. Start using Tableau for your business now!


